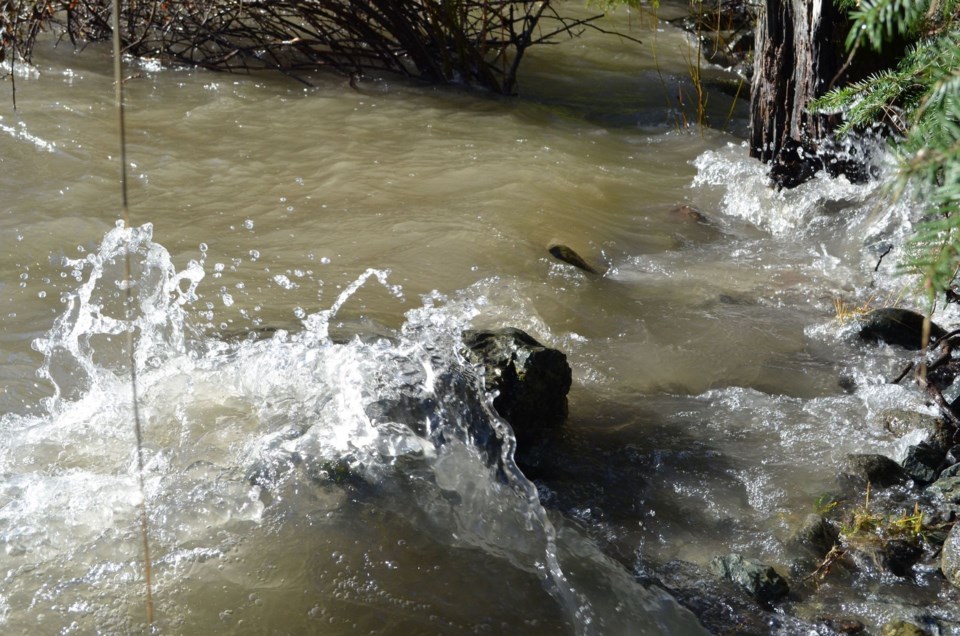
Andrew Hughes’ interview with Jason Ross was excellent at explaining the weather behind the Dec. 27, 2022, flooding downtown. I have just a couple of items to add. When Mr. Ross refers to the freezing level rising to 2,000 metres, that, coupled with the rainfall we were getting, creates what is known as a “rain on snow event.” This type of event raises river water levels even more, as the rivers are receiving a combination of rain and melted snow.
However, as Mr. Ross notes, the king tide of over 5.0 metres gave the river discharge nowhere to go.
The Dec. 27 rainstorm was not that big, and things could have been worse had we experienced higher river flows on top of the king tide. I want to offer a couple of tools folks can use to educate and empower themselves during similar times.
First, many tide apps are available, and these will show when large tides (kings and springs) are going to occur.
I have an app called “Tides” on my phone.
Also, and maybe even more important, is the Water Survey of Canada streamflow gauges at https://wateroffice.ec.gc.ca.
There are three that you could look at when we are getting lots of rain, and the tides are big.
The first gauge is Squamish River at Brackendale, located above the Cheakamus confluence with the Squamish (station number 08GA022).
Next, there is the Cheakamus River at Brackendale (#08GA 043), located on the Cheakamus River just above the Cheakamus/Squamish River confluence.
Finally, there is the Mamquam River above Ring Creek gauge (#08GA075).
You can get real-time river flow and water level data shown on a nice graph for any day you want.
If you add the flows from the three gauges, you can get a sense of total Squamish River flows in the vicinity of downtown.
For example, on Dec. 27, flows at the Squamish at Brackendale gauge were 600 cubic metres per second (cms), flows at the Cheakmaus gauge were 150 cms, and flows at the Mamquam gauge were 153 cms. Together, that’s 903 cms. Now we know that number means for downtown if coupled with a king tide.
If you were here in 2003, you will remember the Oct. 18 flood. It was a whopper; the Squamish River was flowing at 3,100 cms, the Cheakamus at 1,057 cms, and the Mamquam at 296 cms, for a total of 4,453 cms on the Squamish below the Mamquam River!
No dikes were breached, but it was close, and there was much flooding behind the dikes because there was no place for water in the storm drains to go. So really, the Dec. 27 flooding could have been so much worse.
Downtown will remain at risk until the District builds the sea dike. And I have no doubt that the District takes the problem seriously. Funding challenges and those associated with land acquisition and obtaining rights-of-way for the new dike make for delays in the dike construction.
Perhaps until the dike is built, folks can use these tools I have suggested to get a sense of the vulnerability of their businesses and properties. Better yet, I wonder, could the District send alerts out to our phones that flooding is possible and that sandbag stations are being set up? I am sure volunteers would show up to help downtown businesses and residents protect their properties.
Chessy Knight
Northyards


